I’ve run PostgreSQL in everything from tiny startups to high-traffic SaaS platforms. Here’s what actually breaks at scale, the expensive mistakes I made, and the systems that finally let me sleep at night.
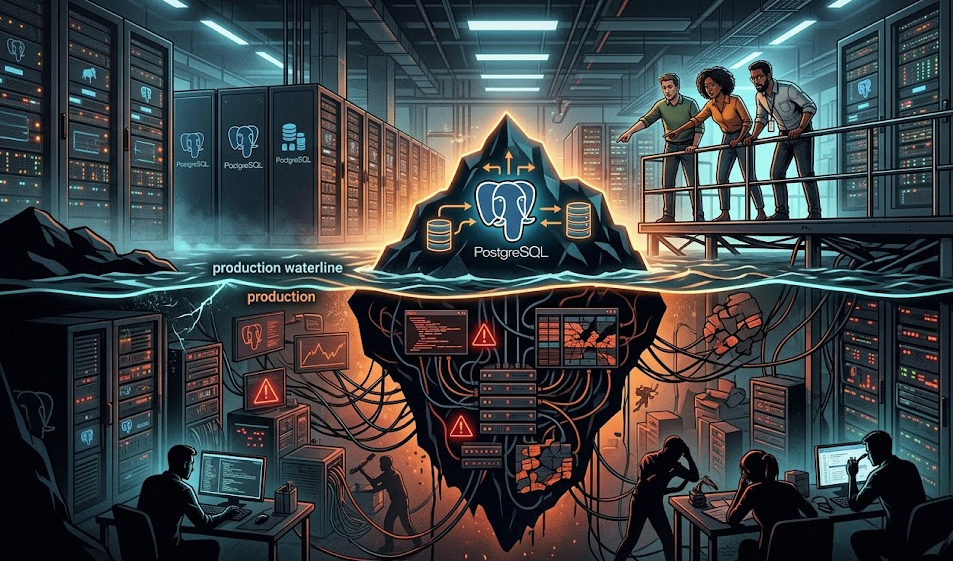
For years I believed the myth: “PostgreSQL is so stable, you barely need to touch it.”
That myth died painfully around 2019 when a production database started randomly spiking to 100% CPU during normal business hours. Customers saw slow responses, support tickets exploded, and we spent an entire weekend chasing ghosts.
Since then, I’ve managed PostgreSQL across more than 15 different companies and environments. I’ve seen it scale beautifully and I’ve seen it bring entire platforms to their knees.
This is not another beginner PostgreSQL tutorial. This is the real-world survival guide — the painful lessons, the costly outages, and the practical systems I now use to keep databases healthy under real production pressure.
Why PostgreSQL Feels Bulletproof… Until It Isn’t
PostgreSQL is incredibly powerful. Excellent ACID compliance, great JSON support, powerful indexing, and a mature ecosystem. But that power comes with complexity. Many teams treat it like a simple black box and only pay attention when queries get slow or the system starts throwing errors.
The biggest trap? Assuming “if it works in staging, it’ll be fine in production.” Production traffic, data growth, and concurrency patterns are completely different beasts.
The Most Expensive PostgreSQL Problems I’ve Experienced
1. Slow Queries That Sneak Up On You
The silent revenue killer. A query that used to take 8ms suddenly takes 800ms after a few months of data growth. One missing index on a frequently joined table can destroy your entire application performance.
I once saw a single SELECT query with a bad JOIN pattern bring an e-commerce checkout flow to its knees during a sale.
2. Connection Pool Exhaustion
Developers love opening new connections. Suddenly you hit the max_connections limit, new requests start failing, and the whole application becomes unresponsive.
3. Table Bloat and Inefficient VACUUM
Autovacuum is great until it isn’t. Bloated tables waste disk space and slow down queries dramatically. I’ve seen tables where 60% of the data was dead tuples.
4. Replication Lag Nightmares
Your replicas fall behind during peak hours. Reads go to replicas but return stale data. Or worse — failover happens and you lose recent transactions.
5. Lock Contention and Deadlocks
Multiple processes fighting for the same rows. Applications start seeing “could not serialize access” errors. Users get random failures.
6. Disk I/O and Storage Problems
Unexpected table growth, missing indexes causing full table scans, or sudden spikes in temporary files filling up disk.
7. Transaction ID Wraparound
This one is scary because it’s rare but catastrophic when it happens. Old transactions not properly vacuumed eventually force the database into emergency mode.
The Turning Point Incident
One of my worst experiences happened in a fintech product. A popular reporting query started doing sequential scans on a 40-million-row table because statistics were outdated. The query went from 400ms to over 45 seconds. Because it was wrapped in a transaction, it held locks for a long time. This caused a cascading effect — other queries started piling up, connection pool filled, and the entire platform became unusable for 35 minutes.
That incident cost real money and trust. It was also the day I decided to stop winging database incidents.
From that point forward, I built proper monitoring, runbooks, and response protocols for every PostgreSQL instance I managed.
How Professional Teams Actually Run PostgreSQL in 2026
- They treat the database as critical infrastructure, not just “storage”
- They monitor query performance continuously (not just CPU and memory)
- They have clear connection management strategies
- They run regular maintenance and bloat cleanup routines
- They maintain up-to-date runbooks for common failure scenarios
The difference between teams that struggle and teams that stay calm during incidents is preparation.
When Everything Goes Wrong at 3 AM
When you get that page, you don’t want to be Googling postgresql slow query while customers are waiting. You need clear decision trees and battle-tested steps.
This is exactly where PostgreSQL War Room becomes extremely valuable. It gives you the 5-minute first-response protocol, diagnosis decision trees, 10 real fix patterns for the most common production problems (runaway queries, connection exhaustion, lock contention, table bloat, replication lag, etc.), copy-paste emergency queries, and production checklists.
I’ve seen similar structured approaches save hours during real outages.
Other Essential Resources
- Production Incident War Room — Because database problems rarely stay isolated
- Linux War Room — Your PostgreSQL still runs on Linux after all
- 30 Production Incidents That Cost $10K+ — Real database-related failures with exact costs and prevention steps
- SQL Performance Cheatsheet — Quick reference for writing better queries
What You Should Do This Week
- Check your top 10 slowest queries using pg_stat_statements
- Review your connection pool settings and usage
- Run a bloat check on your largest tables
- Make sure you have proper monitoring alerts for replication lag and disk usage
- Start building or updating your database incident response playbook
PostgreSQL is one of the best databases available today. But like any powerful tool, it rewards those who respect it and punishes those who take it for granted.
The teams that win aren’t necessarily using the fanciest managed service. They’re the ones who understand their workload, monitor the right metrics, and know exactly what to do when things start degrading.
Stop treating your database as magic. Start treating it as the critical foundation it actually is.
Froquiz has 10,000+ questions across SQL, Docker, Git, AWS, JavaScript, Java, Python, React, Microservices and more — plus a Senior Dev Challenge with real scenario-based questions, not syntax drills. → Froquiz
PostgreSQL in Production: The Hidden Costs and Brutal Truths Most Teams Learn Too Late was originally published in System Weakness on Medium, where people are continuing the conversation by highlighting and responding to this story.